
- Difficulty
- Intermediate
- Build time
- 55-85 min
- Estimated cost
- $0-$15
- Age range
- 10-18
- Workspace
- A clear table about 90 cm wide
The finish line
What you will build
Two vehicles complete a 2-metre speed run and a standard load-pull test with ratios recorded and no gear skipping.
Learning goals
- Identify how equal motor or hand-crank input rotation produces drive-wheel rotation and vehicle motion.
- Construct and explain a rotary transmission-to-linear travel system.
- Measure how gear ratio changes performance.
- Diagnose losses caused by gear mesh friction and wheel slip.
Before you build
Materials, tools, and safety
Reuse-material cost: Usually under $5 with an existing kit. Supervision: Adult help recommended for sharp or heated tools.
Tools
- Ruler
- Pencil
- Scissors
- Timer or phone stopwatch
Low-cost swaps
- Use reclaimed paper and packaging while keeping material limits equal for every team.
- Replace metal test weights with labeled bags of coins or washers.
- Use one vehicle and test configurations sequentially when matching kits are unavailable.
Project-specific safety
- Keep load and drop tests below shoulder height and away from faces.
- Clear the test zone before releasing moving objects or suspended loads.
- Use hand cranks or low-voltage motors only, keep gears covered where possible, and stop before stalled motors or batteries warm.
Orient the build
Place the build so equal motor or hand-crank input rotation is on your left and drive-wheel rotation and vehicle motion is on your right. Call the side facing you the front, the far side the back, the tabletop the bottom, and the opposite face the top.
Build it
Step-by-step instructions
Step 1
Standardize the chassis
Match wheel diameter, axle spacing, mass, and alignment.
Roll both vehicles by hand.
Step 2
Choose two ratios
Build one speed-oriented and one torque-oriented pair.
Record driver and driven tooth counts.
Step 3
Brace the gear meshes
Support both sides of each axle and leave thin side clearance.
Turn ten input rotations by hand.
Builder checkpoint: After brace the gear meshes, the first subassembly should stay aligned when handled gently.
Step 4
Predict wheel speed
Calculate output rotations per input turn for both vehicles.
Mark predictions before racing.
Watch for: If this stage binds or drifts, inspect battery or crank variation before adding more parts.
Step 5
Set the speed course
Tape a straight 2-metre lane and use one release line.
Run three timed trials for each ratio.
Step 6
Build the pull test
Attach the same low-friction 200 g sled to each vehicle.
Use the same surface and line length.
Builder checkpoint: After build the pull test, operate the build slowly and confirm that drive-wheel rotation and vehicle motion begins without binding.
Step 7
Run pulling trials
Measure distance moved in ten seconds or input turns.
Stop if teeth skip or motors stall.
Step 8
Compare tradeoffs
Graph speed-run time against pulling result.
Explain why no ratio wins every task.
Builder checkpoint: At the final checkpoint, Two vehicles complete a 2-metre speed run and a standard load-pull test with ratios recorded and no gear skipping.
See the engineering
Why it works
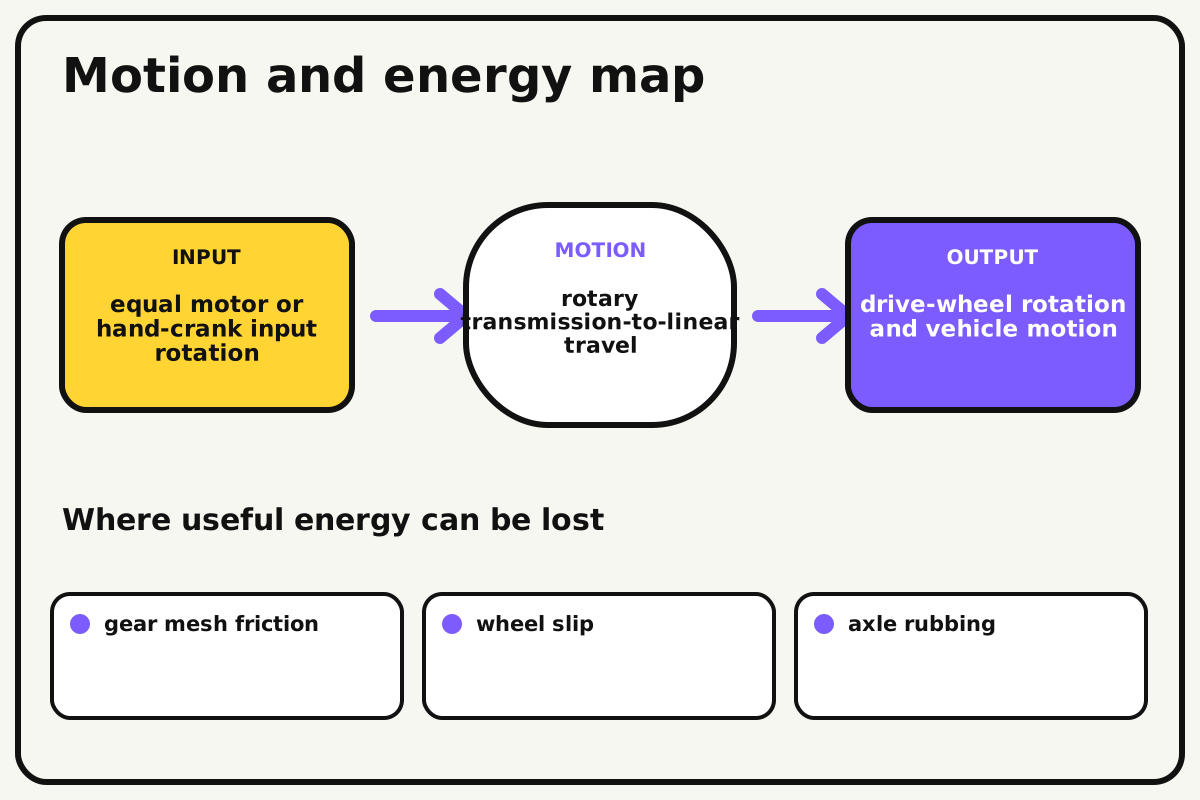
- Input
- equal motor or hand-crank input rotation
- Output
- drive-wheel rotation and vehicle motion
- Motion
- rotary transmission-to-linear travel
- Energy losses
- gear mesh friction, wheel slip, axle rubbing, battery or crank variation
Why this works
Torque-speed gearing
A large driver turning a small driven gear increases output speed but reduces ideal torque. A small driver turning a large gear reduces speed and increases ideal torque.
Look for: Mark one wheel and count rotations for ten input turns before placing either vehicle on the course.
Where the energy goes
Efficiency and losses
The ideal model leaves out gear mesh friction, wheel slip, axle rubbing, battery or crank variation. These effects turn some input energy into heat, sound, vibration, or unwanted motion, so measured performance will be lower than an ideal calculation.
Look for: Run the build slowly and locate the first place where gear mesh friction becomes visible or audible.
Math bite
Predict output speed
Formula: output turns = input turns × driver teeth / driven teeth
- Input = 10 turns
- Driver = 36 teeth
- Driven = 12 teeth
Substitute: output = 10 × 36 / 12 = 30 turns
Result: The drive axle turns 30 ideal rotations for ten input rotations.
Speed increases while ideal axle torque falls to one-third.
Mesh friction and wheel slip change real travel.
Make it behave
Test, troubleshoot, and tune
Controlled test
Start here: Turn each drivetrain ten times while wheels are off the floor.
Success looks like: Both vehicles finish three speed runs and move the standard sled without gear skipping.
Measure: Time, wheel rotations, sled distance, and skipped teeth.
Change: gear ratio
Keep constant: chassis, wheels, mass, input source, lane, sled, and release
- 1:3 speed ratio
- 1:1 ratio
- 3:1 torque ratio
| Symptom | Likely cause | Confirm it | Fix |
|---|---|---|---|
| Gears skip under pull | Mesh supports spread | Hold the vehicle and load gently | Brace both axle bearings |
| One car curves | Axles or wheels differ | Roll with drivetrain disconnected | Realign and match wheels |
| Speed results vary | Release or input energy differs | Use a gate and count input turns | Standardize the start and source |
| Torque setup stalls | Overall friction is high | Lift wheels and operate unloaded | Reduce bearing rub and sled drag |
Choose your tradeoff
Align both vehicles before comparing ratios. Faster gearing magnifies friction and needs more input torque; torque gearing pulls more steadily but gives up wheel speed.
Keep experimenting
Try another version
One-vehicle study
Compare two ratios sequentially.
Mixed-course score
Combine sprint time and pull distance.
Power estimate
Use sled force and speed to estimate useful output power.
Build together
Classroom and access options
Classroom version
Teams can compare gear ratio while keeping chassis, wheels, mass, input source, lane, sled, and release. Assign builder, tester, recorder, and explainer roles; have each team predict the result before collecting three trials.
Access adaptations
- Assign varied roles such as designer, builder, tester, recorder, and presenter.
- Provide pre-measured materials and a visual checklist when helpful.
- Use large color-and-tactile ratio labels and assign build, count, release, timing, and recording roles.
Reflect on the design
- How did gear ratio change the measured result?
- Where did gear mesh friction affect the build most strongly?
- What evidence shows that torque-speed gearing explains the motion?
- Which change would improve drive-wheel rotation and vehicle motion without creating a new problem?
Glossary
- Torque-speed gearing
- A large driver turning a small driven gear increases output speed but reduces ideal torque.
- Input
- The action or energy supplied to a system; here it is equal motor or hand-crank input rotation.
- Output
- The useful response produced by a system; here it is drive-wheel rotation and vehicle motion.
- Efficiency
- The fraction of input energy that becomes useful output instead of friction, sound, heat, or unwanted motion.
Build your dreams
One build can start the next.
Share what you learned, change one variable, and help another builder understand what worked.
Explore more guidesSources and build notes
A common classroom engineering challenge implemented with original constraints, diagrams, and measurement guidance.
- Classroom challenge basis: A controlled-variable engineering activity with original constraints, scoring ideas, and measurement guidance.
Written and edited by BrickLabClips. Published 2026-07-22; updated 2026-07-22.
Next builds
Related guides
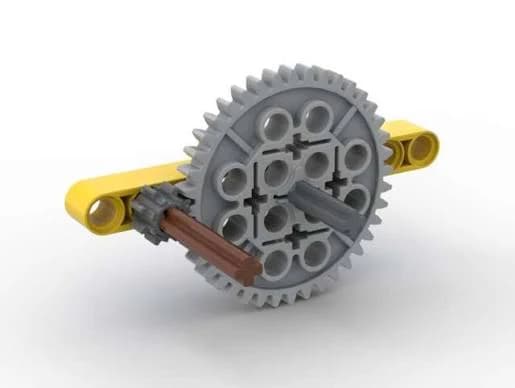
Gear Ratio Demonstrator
Turn one crank and compare how gear size changes output speed, direction, and turning force.
Brick-compatible mechanismsDifferential-Steer Rover Chassis
Control a rover by changing left and right wheel speeds, enabling straight travel, arcs, and turns in place.
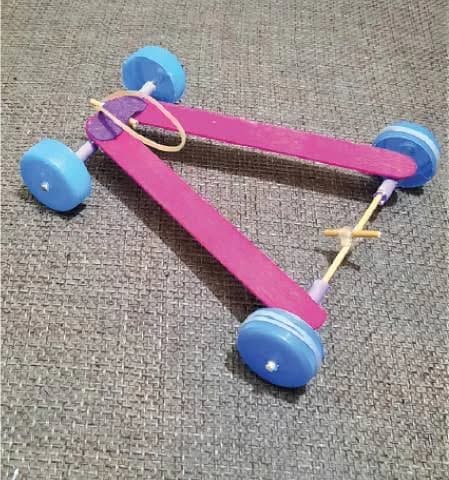
Rubber Band Car
Store energy in a twisted rubber band, release it through the drive axle, and tune a lightweight car for distance.