- Difficulty
- Beginner
- Build time
- 35-55 min
- Estimated cost
- $0-$6
- Age range
- 10-16
- Workspace
- A clear table about 90 cm wide
The finish line
What you will build
The team records repeatable starting and sliding force for at least three surfaces and explains one fair comparison.
Learning goals
- Identify how horizontal pull measured by a spring scale produces sled motion across a test surface.
- Construct and explain a linear force-to-linear sliding system.
- Measure how surface material changes performance.
- Diagnose losses caused by surface deformation and pull-angle variation.
Before you build
Materials, tools, and safety
Reuse-material cost: $0-$3 with reused materials. Supervision: Adult help recommended for sharp or heated tools.
Tools
- Ruler
- Pencil
- Scissors
- Timer or phone stopwatch
Low-cost swaps
- Use reclaimed paper and packaging while keeping material limits equal for every team.
- Replace metal test weights with labeled bags of coins or washers.
- Calibrate a rubber band against known masses if a spring scale is unavailable.
Project-specific safety
- Keep load and drop tests below shoulder height and away from faces.
- Clear the test zone before releasing moving objects or suspended loads.
- Use bagged masses, pull away from faces, keep the lane at floor level, and stop if the spring scale is damaged.
Orient the build
Place the build so horizontal pull measured by a spring scale is on your left and sled motion across a test surface is on your right. Call the side facing you the front, the far side the back, the tabletop the bottom, and the opposite face the top.
Build it
Step-by-step instructions
Step 1
Square the sled
Build a flat base with low walls and a centered pull loop.
Round the front edge so it cannot dig in.
Step 2
Mark the lane
Tape a straight 1-metre path and place the first surface strip flat.
Keep joints out of the measured section.
Step 3
Zero the scale
Hold it horizontal in the pull direction and check zero.
Use the same operator and height.
Builder checkpoint: After zero the scale, the first subassembly should stay aligned when handled gently.
Step 4
Measure starting force
Increase pull slowly until the sled begins moving.
Record the highest reading before motion.
Watch for: If this stage binds or drifts, inspect scale oscillation before adding more parts.
Step 5
Measure sliding force
Continue at steady slow speed and record the typical reading.
Repeat three times.
Step 6
Change the surface
Test two more materials with the same 300-gram load.
Reset the same start point.
Builder checkpoint: After change the surface, operate the build slowly and confirm that sled motion across a test surface begins without binding.
Step 7
Change the load
On one surface, test 100, 300, and 500 grams.
Keep speed and pull angle fixed.
Step 8
Compare evidence
Average each set and separate start from sliding values.
Explain anomalies rather than deleting them.
Builder checkpoint: At the final checkpoint, The team records repeatable starting and sliding force for at least three surfaces and explains one fair comparison.
See the engineering
Why it works
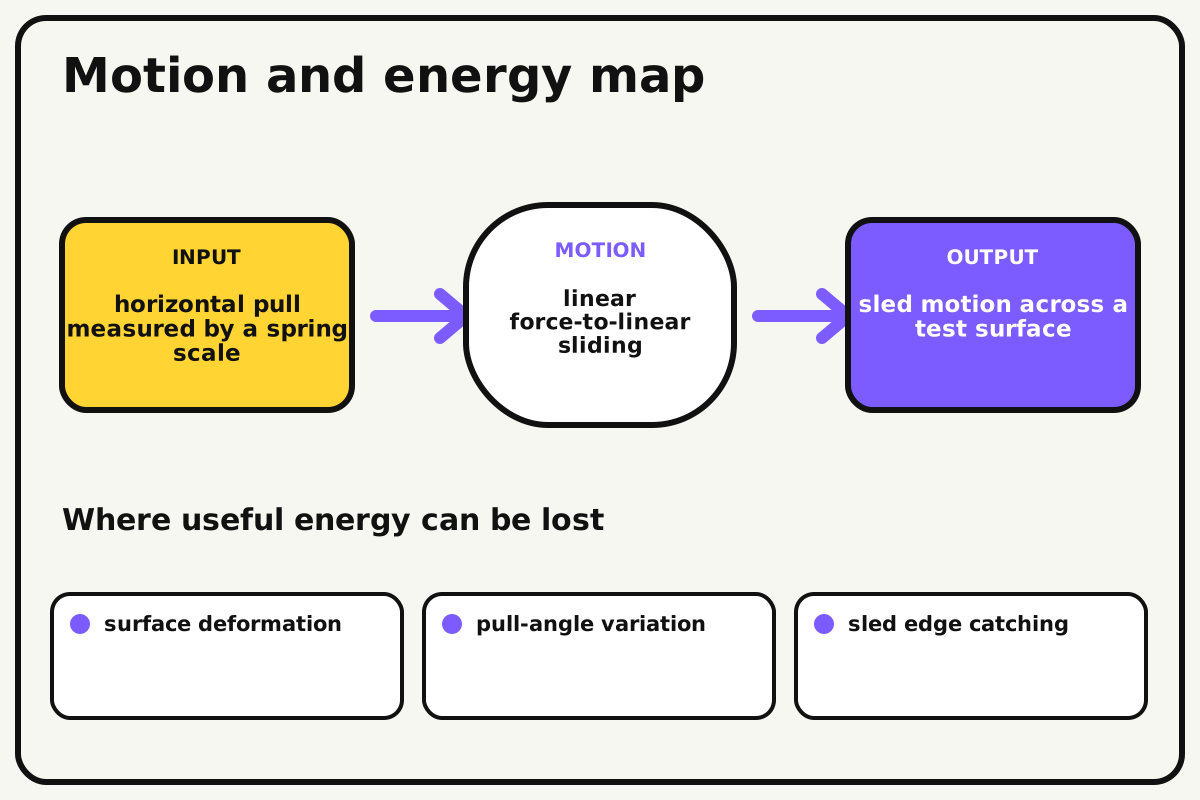
- Input
- horizontal pull measured by a spring scale
- Output
- sled motion across a test surface
- Motion
- linear force-to-linear sliding
- Energy losses
- surface deformation, pull-angle variation, sled edge catching, scale oscillation
Why this works
Static and kinetic friction
Static friction resists the start of motion up to a maximum. Once sliding begins, kinetic friction often settles to a lower value for the same materials and load.
Look for: Watch the scale peak just before motion and compare it with the steadier reading while the sled moves.
Where the energy goes
Efficiency and losses
The ideal model leaves out surface deformation, pull-angle variation, sled edge catching, scale oscillation. These effects turn some input energy into heat, sound, vibration, or unwanted motion, so measured performance will be lower than an ideal calculation.
Look for: Run the build slowly and locate the first place where surface deformation becomes visible or audible.
Math bite
Estimate friction coefficient
Formula: coefficient μ = friction force / normal force
- Sliding force = 1.5 N
- Normal force = 3.0 N
Substitute: μ = 1.5 / 3.0 = 0.50
Result: The measured kinetic friction coefficient is about 0.50 for this pair.
The value is experimental rather than a universal material constant.
Pull angle and surface compression affect the estimate.
Make it behave
Test, troubleshoot, and tune
Controlled test
Start here: Pull the empty sled once and inspect whether its front edge catches.
Success looks like: Three trials on each surface agree closely enough to compare starting and sliding force.
Measure: Peak start force, steady sliding force, load, and surface.
Change: surface material
Keep constant: sled, load, lane, pull angle, speed, operator, and scale
- paper
- felt
- smooth plastic
| Symptom | Likely cause | Confirm it | Fix |
|---|---|---|---|
| Readings jump wildly | Pull speed or angle changes | Film the scale and hand | Use a guide line and slower pull |
| The sled tips | Pull loop is high or load off-center | Pull empty from the side view | Lower the loop and center mass |
| One surface wrinkles | Strip is not secured | Inspect before each pull | Tape edges outside the lane |
| Starting force is missed | Scale is read after motion begins | Have one observer call the peak | Use video or a force gauge hold function |
Choose your tradeoff
Control the pull angle and speed before interpreting small differences. Added mass usually increases friction force, but the ratio may shift if soft surfaces deform.
Keep experimenting
Try another version
Two-surface comparison
Use one load and three trials.
Wheel conversion
Add wheels and compare rolling resistance.
Uncertainty
Report mean, range, and likely measurement error.
Build together
Classroom and access options
Classroom version
Teams can compare surface material while keeping sled, load, lane, pull angle, speed, operator, and scale. Assign builder, tester, recorder, and explainer roles; have each team predict the result before collecting three trials.
Access adaptations
- Assign varied roles such as designer, builder, tester, recorder, and presenter.
- Provide pre-measured materials and a visual checklist when helpful.
- Use a large pull handle, tactile surface labels, and separate pulling, reading, observing, and recording roles.
Reflect on the design
- How did surface material change the measured result?
- Where did surface deformation affect the build most strongly?
- What evidence shows that static and kinetic friction explains the motion?
- Which change would improve sled motion across a test surface without creating a new problem?
Glossary
- Static and kinetic friction
- Static friction resists the start of motion up to a maximum.
- Input
- The action or energy supplied to a system; here it is horizontal pull measured by a spring scale.
- Output
- The useful response produced by a system; here it is sled motion across a test surface.
- Efficiency
- The fraction of input energy that becomes useful output instead of friction, sound, heat, or unwanted motion.
Build your dreams
One build can start the next.
Share what you learned, change one variable, and help another builder understand what worked.
Explore more guidesSources and build notes
A common classroom engineering challenge implemented with original constraints, diagrams, and measurement guidance.
- Classroom challenge basis: A controlled-variable engineering activity with original constraints, scoring ideas, and measurement guidance.
Written and edited by BrickLabClips. Published 2026-07-22; updated 2026-07-22.